The Military Expenditures and Arms Transfer Report Has Been Published Since the 1960s
Dave DeCamp / AntiWar.com
(September 19, 2022) — The State Department announced in August that it will no longer publish World Military Expenditures and Arms Transfers (WMEAT) reports, which have been released by the US government since the 1960s.
The WMEATs detail US global military spending, arms transfers, and related data for each country in the world. The 2022 National Defense Authorization Act (NDAA) included an amendment that repealed a 1994 provision requiring the State Department to publish a WMEAT each year.
“Section 5114(b)(4) of the National Defense Authorization Act for Fiscal Year 2022 repealed the 1994 statutory provision that required the Department of State to publish an edition of WMEAT every year. Consistent with this repeal, the Department of State will cease to produce and publish WMEAT,” the State Department said on its website.
The State Department said that the report it published in 2021 was the “final edition” of the WMEAT. The 2021 WMEAT covered an 11-year period from 2009 through 2019 and found that the US was by far the world’s largest arms dealer. During that period, about “79 percent of world arms trade by value appears to have been supplied by the United States.”
The discontinuation of the WMEAT reports, which reduces the US government’s transparency, comes as the US is shipping billions of dollars worth of arms into Ukraine with virtually no oversight. Since Russia invaded on February 24, the US has pledged $15.1 billion in weapons for Kyiv.

World Military Expenditures and Arms Transfers 2021 Edition
(December 30, 2021) — This edition of World Military Expenditures and Arms Transfers (WMEAT), WMEAT 2021, published in December 2021, covers the eleven-year period from 2009 through 2019. WMEAT responds to a statutory requirement, codified in 22 USC 2593b, that the US Department of State annually publish detailed, comprehensive, and statistical information regarding military expenditures, arms transfers, armed forces, and related economic data for each country of the world, as well as in-depth analyses of arms transfers and proliferation trends.
Comments, including suggestions for improvement of WMEAT and identifications of apparent errors, may be addressed to WMEATeditor@state.gov.
This edition of WMEAT is published electronically, on the website of the US Department of State, in the form of four downloadable documents:
• This Introduction and Overview section, in a PDF document [128 KB];
• Table I, the Military Expenditures and Armed Forces Personnel table, in an Excel spreadsheet workbook [4 MB] containing eight “world pages” (pages of global scope) and 170 country pages;
• Tables II — IV, the Arms Transfer Deliveries tables, in an Excel spreadsheet workbook [1 MB] containing thirteen “world pages” (no country pages); and
• A Sources, Data, and Methods section, in a PDF document [474 KB].
The Tables make up the body of this report. They offer much information not described in the Overview. The “Sources, Data, and Methods” section details the methodological basis for data in the tables, especially with respect to substantial and pervasive uncertainties and sources of error.
Table I presents annual and eleven-year-mean information about number of armed forces personnel, population, labor force, military expenditures, gross domestic product (GDP), and ratios of these parameters, for individual countries, for geographic, economic, and political groups of countries, and for the world. It also presents annual and eleven-year-mean Freedom House “political rights” scores and World Bank Institute “voice and accountability in governance” scores for individual countries.
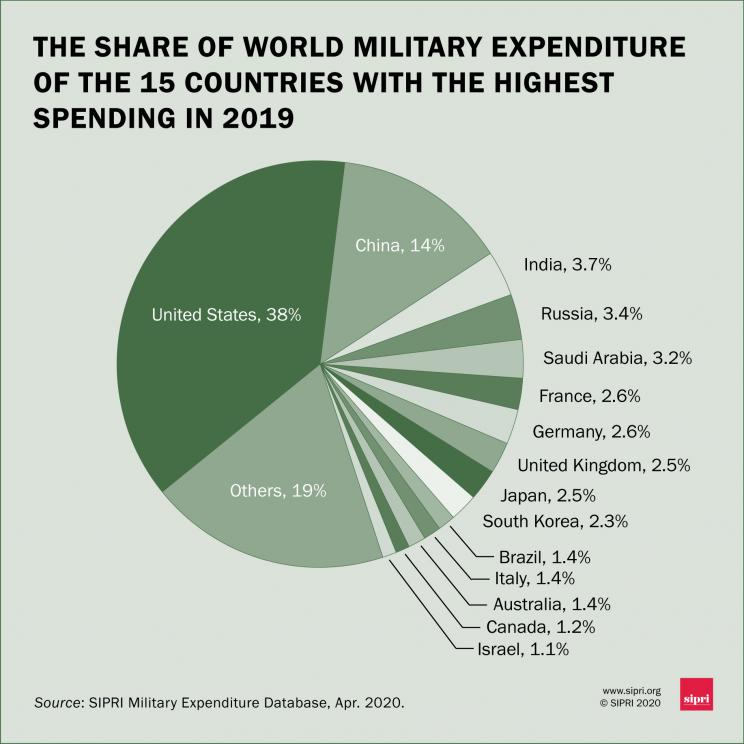
Table II presents annual and eleven-year-mean information about the value of exports and imports both of arms and of all goods and services, and ratios of these parameters, for individual countries, for geographic, economic, and political groups of countries, and for the world.
Table III presents a matrix of world arms transfer values by major supplier and country of destination for the three-year period from 2017 through 2019.
Table IV presents annual and eleven-year-mean information about the value of arms exports of major suppliers to individual countries; to geographic, economic, and political groups of countries; and to the world.
The “Group Rankings and Trends” and “Country Rankings and Trends” pages of both the military expenditures workbook and the arms transfers tables workbook offer rankings of both of countries and of groupings of countries, by every demographic, economic, and political parameter used in preparing this report, and also by a measure of average annual change for military parameters.
New features in each edition of WMEAT are described at the start of the “Sources, Data, and Methods” section. WMEAT 2021 contains no changes in format or method. However, due to impediments posed by responses to the Coronavirus Disease 2019 (COVID-19) pandemic:
• No 2020 edition of WMEAT was published; and
• In WMEAT 2021, figures for the two most recent years covered, especially 2019, tend to be based on less information and hence are published with a lower degree of certainty than figures for earlier years.
Military expenditure and GDP values and ratios involving them may vary greatly depending on currency conversion method used, and no single currency conversion method is equally suitable for all analytic purposes. The “Overview” page of Table I indicates the range of variation across conversion methods of military spending both in absolute terms and relative to GDP, for all countries and groups of countries, for both the latest year covered and the eleven-year period average. The conversion methods used, and the advantages and disadvantages of each, are described in the “Sources, Data, and Methods” section.
Overview
WMEAT figures, especially for armed forces personnel, military expenditures, and arms transfers, are neither so accurate nor so reliable as uniform presentation in statistical tables might seem to imply. This may be due to incompleteness, ambiguity, or total absence of data for some countries either in those parameters or in parameters, such as GDP price deflators or exchange rates, used in Table I to convert local-currency-denominated values for military spending and GDP to US dollars.
In Table I, apparent sources of error and extent of imprecision vary across countries, years, and parameters, and are indicated by color-coding on the pages for specific countries. In Tables II, III, and IV, the quality of source data for arms transfer values is not readily assessable. In no table does either rounding or limitation on significant digits adequately reflect potential inaccuracy.
Millitary Expenditures
From 2009 through 2019, in constant 2019 US dollar terms, the annual value of world military expenditures appears to have risen about 1 percent to 11 percent, from a possible range of $1.82 trillion to $2.66 trillion in 2009 to a possible range of $1.94 trillion — $2.96 trillion in 2019, and to have averaged between $1.81 trillion and $2.76 trillion per year over the 11-year period.
This range of values results from WMEAT’s use of five different methods to convert non-US military expenditures to US dollars. Using a real market exchange rate (MER) with a base year of 2019 for each country yields the lowest period-average value for annual global military expenditures; using the purchasing power parity rate for each foreign country’s whole economy (PPP-for-GDP) yields the highest such value.

Military Burden (Military Expendiures to GDP)
During the 11-year period the share of global GDP to which global military expenditure was equivalent — an indicator sometimes called “the military burden” — appears to have averaged between 1.9 percent and 2.4 percent, trending downward.
Converting non-US military expenditures and GDPs to US dollars using a real MER yields the greatest period-average military burden; converting non-US GDPs at PPP-for-GDP while converting non-US military expenditures at a notionally estimated defense-sector-specific PPP rate yields the lowest period-average military burden.
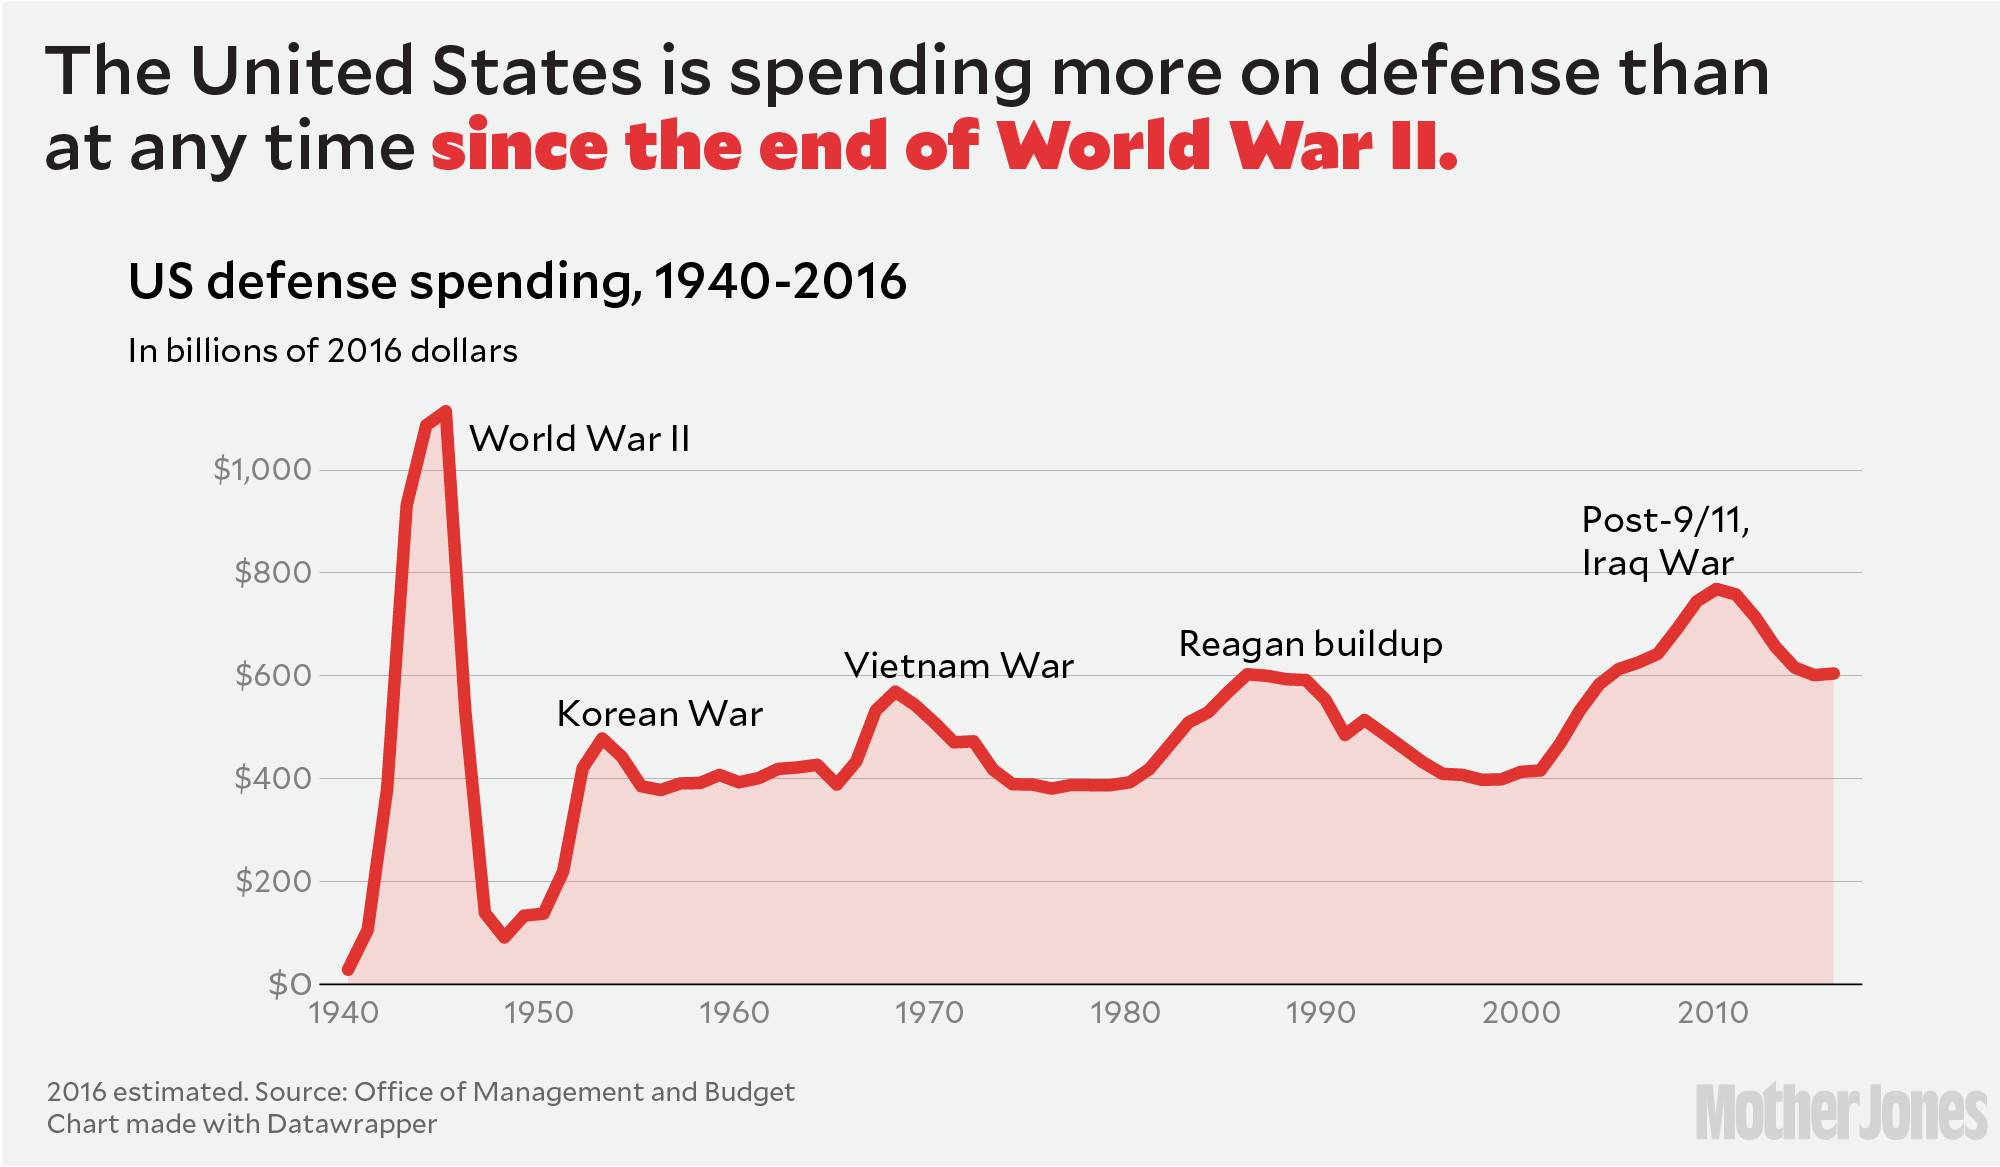
Throughout the period, military spending accounted for a far lower share of measured global economic output than in 1989, at the end of the Cold War, when it appears to have been about 4.7 percent at a real MER.

Armed Forces
The number of people serving in the world’s armed forces appears to have fallen about 3 percent in absolute terms over the period covered in WMEAT 2021, from about 21.1 million persons in 2009 to about 20.4 million in 2019, troughing at about 20.2 million in 2016.
From 2009 to 2019, the world total of armed forces personnel appears to have fallen about 14 percent in per capita terms, from about 0.31 percent to about 0.27 percent of total population. It appears to have fallen by about 13 percent as a proportion of the labor force, from about 0.68 percent in 2009 to about 0.59 percent in 2019.
Armed forces personnel as a share of the labor force appears to have trended downward over the period in every region, for every quintile of world population ranked by GDP per capita, and for every quintile of world population ranked by NGO-assessed degree of democracy.
From 2009 through 2019, world military expenditures per armed forces member — an indicator of the capital-intensivity of the military — appear to have risen by 4 percent to 15 percent; results vary depending on which method of converting non-US military expenditures to US dollars is used.
Military-spending-per-armed-forces-member appears to have risen for every economic and political group of countries and in all regions except North America, East Africa and Southern Africa.
The world ratio of military spending per armed forces member to GDP per labor force member — an indicator of the capital-intensivity of the military relative to that of the economy as a whole — appears to have trended downward for the eleven-year period, and to have trended downward most sharply in North America and East Africa and among the most democratically governed quintile of the world’s population.

Arms Tranfers
From 2009 to 2019, the global annual value of international arms transfer deliveries appears to have averaged about $204 billion in constant 2019 US dollar terms, and to have risen by about 25 perecent, from about $169 billion in 2009 to about $212 billion in 2019.
The arms trade’s share of world trade in goods and services appears to have ranged from about 0.8 percent to about 1.0 percent, averaging about 0.9 percent of world trade, with no clear increasing or decreasing trend.
During the eleven-year period covered in WMEAT 2021, about 79 percent of world arms trade by value appears to have been supplied by the United States, about 10 percent by the European Union, about 5 percent by Russia, and less than 2 percent by China. There was no clear trend in US, EU or Russian market share during the period, but China’s market share grew.
Countries in the richest quintile of world population appear to have accounted for about 97 percent of world arms exports and more than 60 percent of world arms imports, regardless of whether quintiles are based on national GDP per capita at a real MER or at PPP. By either standard, the richest quintile was the only GDP-per-capita quintile with a positive arms trade balance.
Countries in the most democratic quintile of world population appear to have accounted for about 91 percent of world arms exports and 47 percent of world arms imports. The most democratic quintile was the only degree-of-democracy quintile with a positive arms trade balance.
In constant 2019 US dollar terms, US arms exports appear to have averaged about $162 billion per year, while US arms imports — of arms merchandise only, inasmuch as no data on US arms imports in the form of services are readily available — appear to have averaged about $6 billion per year. Over the period, the arms trade surplus of the United States may have offset as much as 28 percent of its total trade deficit.
Between 63 percent and 65 percent of US arms exports appear to have been delivered to countries in the richest quintile of world population, which appear to have sourced between 82 percent and 83 percent of their arms imports from the United States.
About 51 percent of US arms exports appear to have been delivered to countries in the most democratic quintile of world population, which appear to have sourced about 86 percent of their arms imports from the United States.
Of US arms exports, about 20 percent appear to have gone to multinational entities or entities not specified by the governmental exporting or export licensing authority.
Both the growth in the world arms trade and the high proportion of world arms imports supplied by the US appear to have been due largely to reliance on the United States as a source of arms by other rich, democratically-governed countries.
Posted in accordance with Title 17, Section 107, US Code, for noncommercial, educational purposes.