
More than Twice Acknowledged Level:
New Estimates Based on US National Accounts
Gisela Cernadas and John Bellamy Foster / Monthly Review
Note: Footnotes and missing charts can be viewed online.
(November 1, 2023) — For decades, it has been recognized by independent researchers that actual US military spending is approximately twice the officially acknowledged level.1 In 2022, actual US military spending reached $1.537 trillion—more than twice the officially acknowledged level of $765.8 billion.
Data on US military spending reported by the US government, the Stockholm International Peace Research Institute (SIPRI, generally considered the definitive source on international military expenditures), and NATO all primarily rely on the figures of the US Office of Management and Budget (OMB).2 These data, however, are subject to two major shortcomings.
First, the numbers provided by the OMB with respect to “defense spending” are substantially lower than those provided in the US National Income and Product Accounts (NIPA), the most complete and definitive source on US national income and expenditures as a whole, constituting an input-output approach to the whole economy, and the basis of all analysis of the US economy.
Second, as is well-known, key areas of US military spending are included in other parts of federal expenditures and do not fall under the OMB’s “defense spending” category.
Although SIPRI and NATO adopt wider definitions of “defense spending” than the US government and claim to increase their estimates using the OMB figures as a base, in practice, they do so only marginally and in ways that are not entirely transparent, with the result that their figures are only slightly above those of the officially acknowledged US figures.3
If the reality is that actual US military spending has been consistently around twice the acknowledged amounts—something demonstrated repeatedly in independent studies—the methodology for approaching the question of actual military spending on a consistent, statistically conservative, and incontestable basis has only developed over time.
Most attempts have sought simply to add components of actual military spending appearing in other parts of federal spending and not included under OMB figures for “national defense.” Although these studies helped to set the stage, they often appeared to have a scattered and arbitrary character, rather than employing a truly consistent methodology.
A breakthrough in this respect was first achieved by Jurgen M. Brauer at Augusta State University’s College of Business Administration in 2007. Brauer introduced an approach that took the NIPA data on US military consumption and investment expenditures as the base for US military spending, and then added in other military expenditures outside of official defense using the NIPA accounts, creating a methodology for detailing US military expenditures that not only surmounted the limitations of the OMB data with respect to accounting for “defense spending” itself, but adopted an entirely consistent approach, based on NIPA data, to adding in unacknowledged expenditures.4
Brauer’s approach was then developed further by Hannah Holleman, John Bellamy Foster, and Robert W. McChesney in an article in Monthly Review in 2008 that provided detailed estimates of actual US military expenditures, as opposed to those officially acknowledged by the OMB, for 2007.5
Although the estimates of military spending here rely on the 2008 study by Holleman, Foster, and McChesney (building on Brauer’s 2007 methodological breakthrough) as its original basis, the method and results differ somewhat from that earlier study, adopting more conservative assumptions, while incorporating some refinements that Brauer introduced in 2019.
Thus, the percentages attributed to the military in federal space expenditures and in grants to foreign countries are lower in the present estimates, in accord with widely accepted mainstream assumptions. Military medical insurance (consisting of payments for medical services for dependents of active duty military personnel at nonmilitary facilities) is also added, which was not included in the earlier study by Holleman, Foster, and McChesney. (It should be noted that military spending in the Department of Energy associated with nuclear weapons is included in both OMB and NIPA, as recognized in the earlier study.)

In addition to the NIPA data for total defense consumption and gross investment expenditures, our figures for actual US military expenditures include seven further categories: veterans’ benefits, veterans’ life insurance, other veterans’ costs, military medical insurance, the military portions of space spending, grants in aid to other governments, and the share of net interest attributed to actual federal military expenditures.
(Net interest here includes only “on-budget” net interest, excluding the “off-budget” net interest associated with Social Security and other transfer payments, as well as the Post Office.)
Veterans’ benefits and net interest both constitute what are known as so-called legacy costs of militarism and war, and thus are part of overall military spending, but are not included in the official “defense budget.” Euroconsult has attributed 42.4 percent of federal space consumption and investment expenditure to the military.6 The Council of Foreign Relations conservatively classified 33 percent of all US grants in foreign aid as for military purposes.7
All of these categories, taken together, thus constitute the components of actual military spending as shown in Table 1. The table shows that actual US military spending in 2022 came to $1.537 trillion, as opposed to the $765.8 billion in acknowledged (OMB) defense spending (and the $876 billion estimated by SIPRI and $821 billion by NATO). This means that actual US military spending in 2022 was more than double the acknowledged “defense spending” provided by OMB.

Table 1. Actual US Military Spending in 2022 (Billions USD)
Sources: See Table 2 in Statistical Appendix for a discussion of data and sources.
* Since the data corresponding to “Veterans-Related Expenses,” from NIPA Table 3.12 (“Government Social Benefits”) for the year 2022 were not available at time of writing, we adopted a conservative assumption and assigned the same nominal value that such expenses adopted in 2021.
** Since the data corresponding to “Space Consumption and Gross Investment Expenditure,” from NIPA Table 3.15.5 (“Government Consumption Expenditures and Gross Investment by Function”) for the year 2022 were not available at time of writing, we adopted the same nominal value from the year 2021 for this variable.
*** The details corresponding to the calculation of this item are explained in the Statistical Appendix, Table A-2.
Chart 1 shows actual US military spending as a percentage of GDP, compared to the acknowledged defense spending and the closely related SIPRI data from 2007 (the year in which the Great Recession began) to 2022. Over the entire period, actual military spending (NIPA augmented) as a percentage of GDP averaged 6.7 percent. In 2022, actual US defense spending came to 6 percent of GDP, while acknowledged military spending was only half that, at 3 percent of GDP.
Chart 1. Military Spending as Percentage of GDP
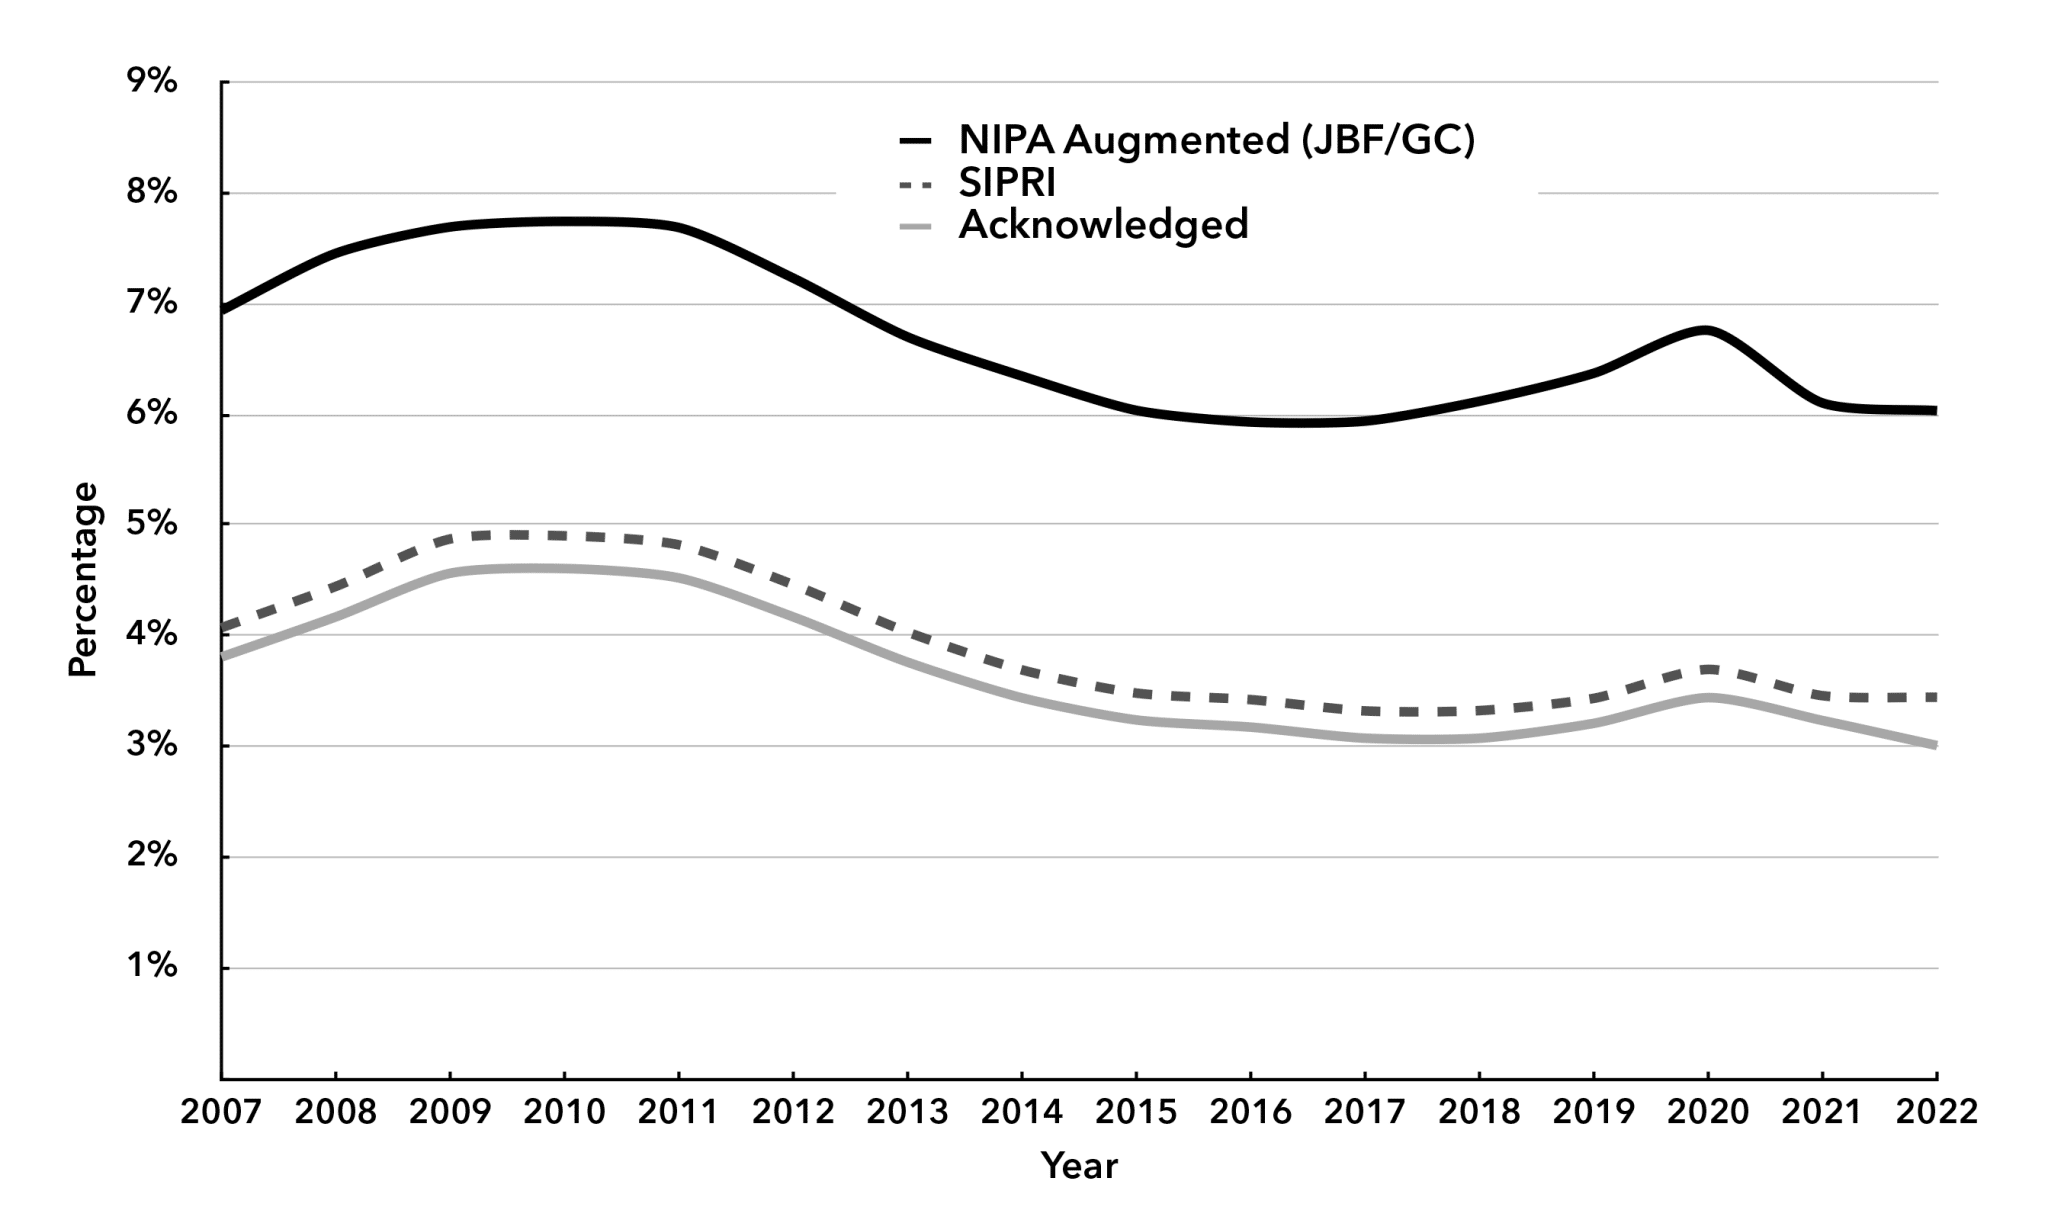
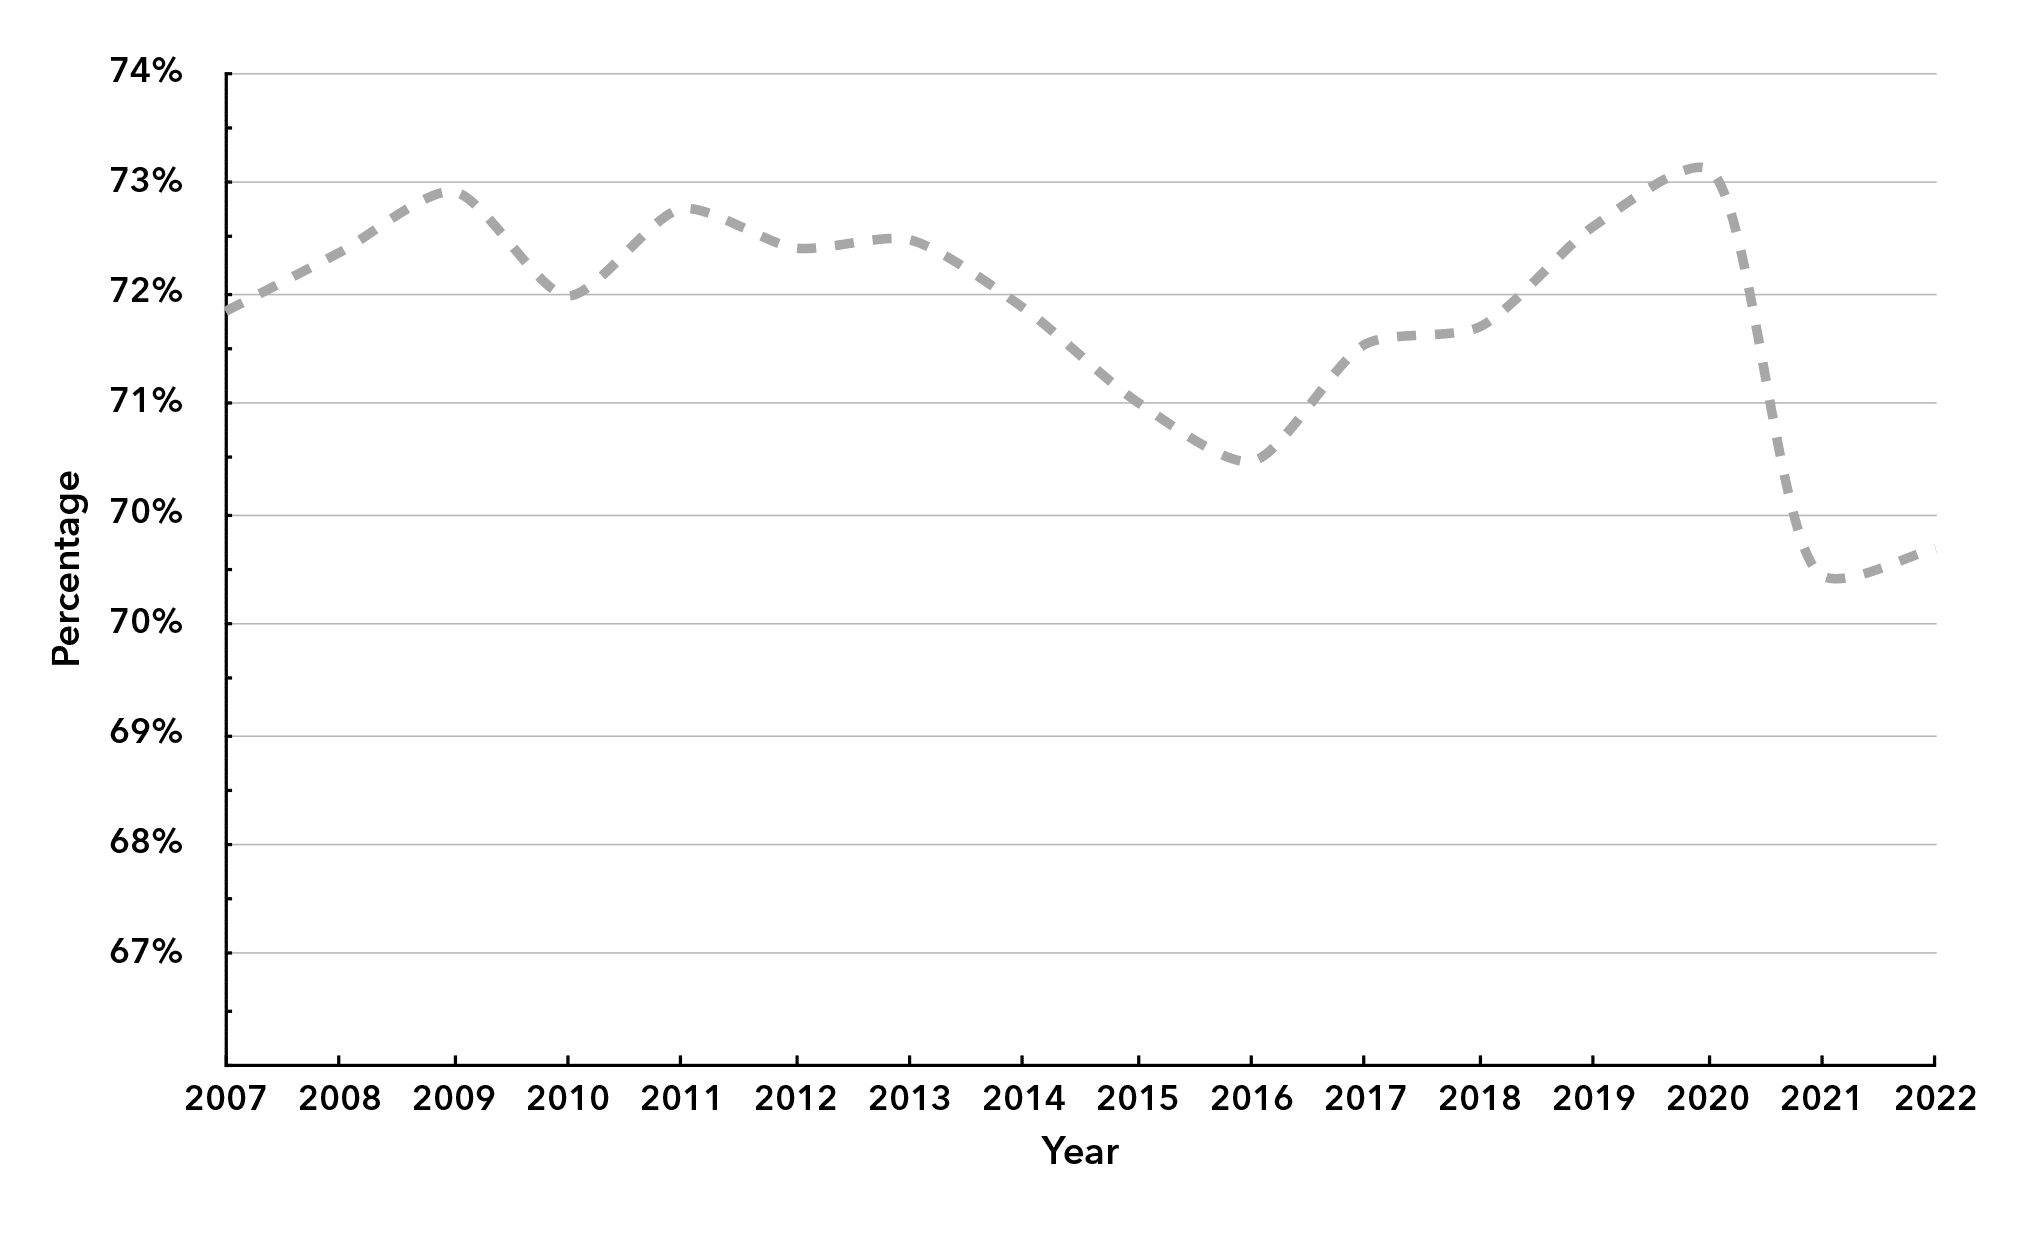
Chart 2 presents actual military spending as a percentage of total federal government consumption and gross investment, which averaged 72 percent over the entire period and, in 2022, was 70.2 percent. Once again, however, it is rising.
Chart 2. Military Spending as Percentage of Federal Consumption and Gross Investment, 2007–2022
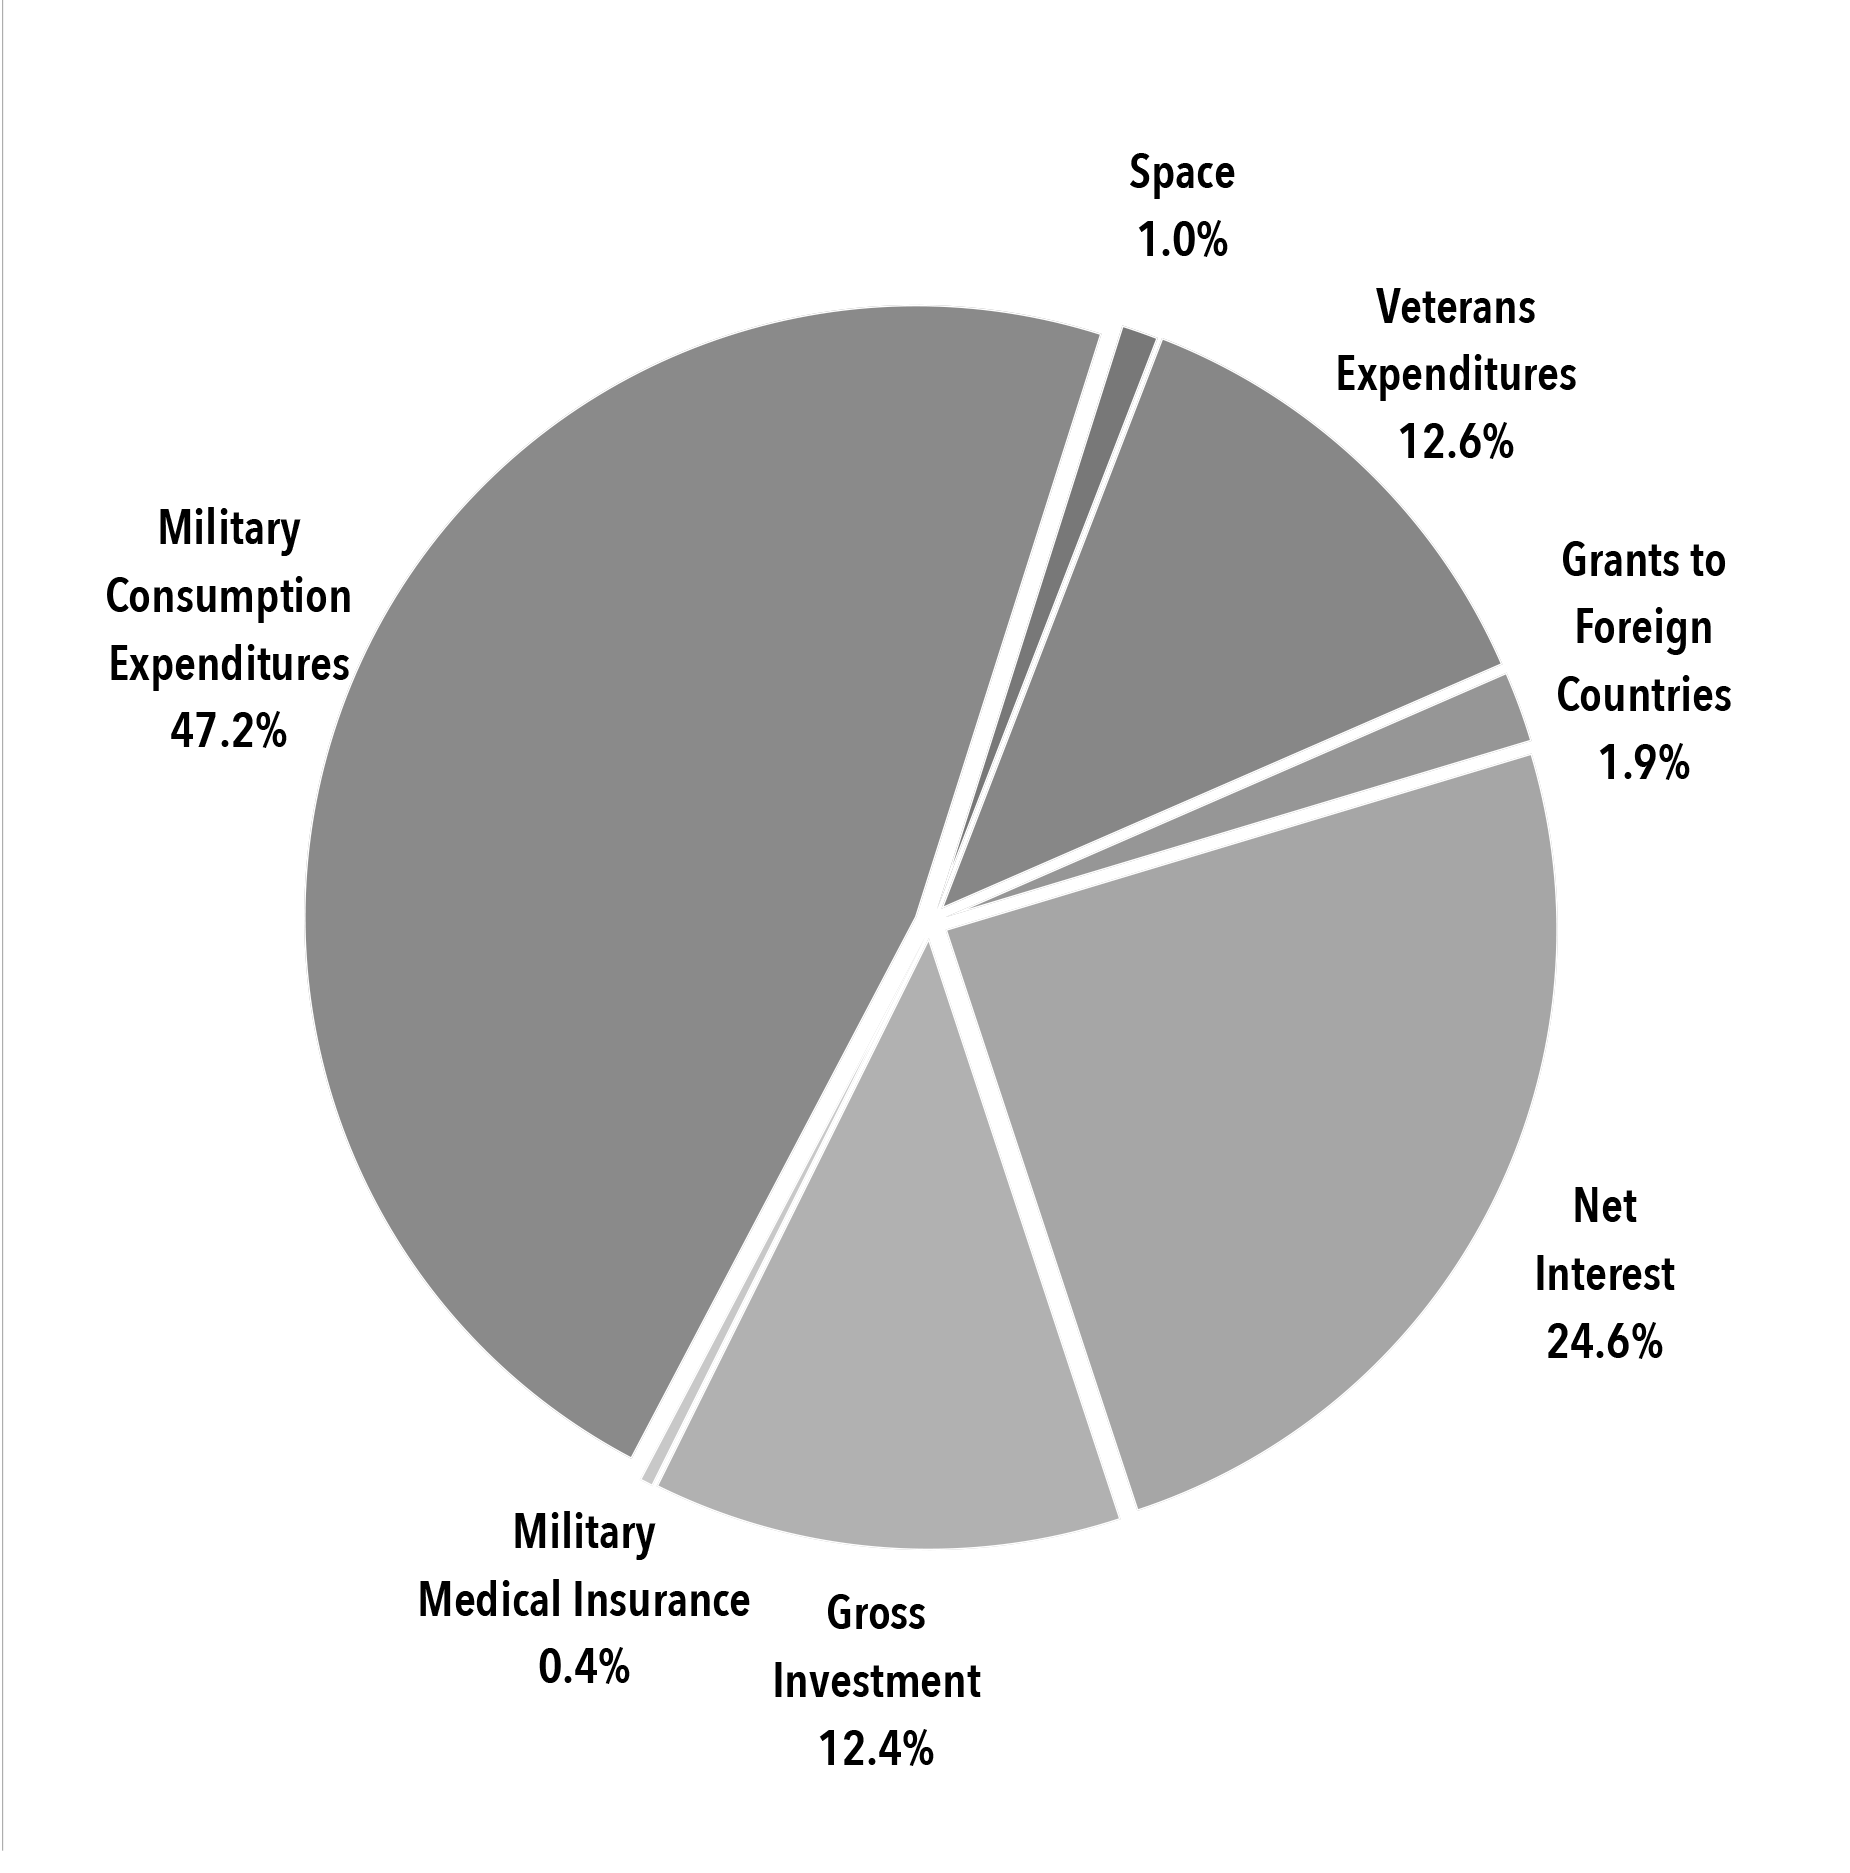
“National Defense Consumption Expenditures” and “National Defense Gross Investment” accounted, respectively, for 47 percent and 13 percent of actual military spending in 2022, according to NIPA. The remaining 40 percent of US military spending is not included in OMB figures or in the larger figures on “defense” spending reported by the Bureau of Economic Analysis in NIPA, but appears in other budgets in NIPA. The breakdown is shown in Chart 3.
Chart 3. US Military Spending by Component, 2022
All of this demonstrates that the extent of US military spending has been grossly understated by the US government. Washington has allocated expenses corresponding to military-related activities under departments other than the Department of Defense.
Although institutions like SIPRI and NATO claim to reflect the actual military spending of most countries, their estimations for the United States are vastly understated. Moreover, it is important to recognize that the base data from which we start our calculations (National Defense Consumption and Gross Investment Expenditure, using US Bureau of Economic Analysis NIPA tables) are already larger than the final estimations reported by SIPRI and NATO.
Central to the estimates of actual military expenditure presented here, then, is the fact that expenses of military-related activities are not fully included under the expenditure announced by the OMB. Significantly, legacy costs, which support the entire military systems, such as veterans’ benefits and the enormous net interest payments attributable to the military and largely responsible for US government deficits, are fully incorporated in our analysis, while excluded in military spending acknowledged by the US government and largely excluded by SIPRI (see Statistical Appendix).
It is no wonder, then, that, taking the ten countries with the highest military spending in the world in 2022, the United States—based on its actual military spending as shown here—accounts for more than 70 percent of the total.8
Statistical Appendix
Methodological Approach
To estimate actual US military spending, we utilize a set of nine items from the National Income and Product Accounts (NIPA) produced by the US Bureau of Economic Analysis (see Table A-1). The criteria to allocate each of these items is described below:
- National Defense consumption expenditure.This information is provided by the US Bureau of Economic Analysis. We allocate 100 percent of this item to the estimation of the US military spending.
- National Defense gross investment expenditure.This information is provided by the US Bureau of Economic Analysis. We allocate 100 percent of this item to the estimation of the US military spending.
- Veterans’ related costs.This information is provided by the US Bureau of Economic Analysis and consists of three categories:
- Veterans’ life insurance
- Veterans’ benefits
- Other
Table A-1. Sources for Calculation of Actual Military Spending
We allocate 100 percent of the items 3.a and 3.b to the estimation of the US military spending. The category “Other” (3.c) is shared among other institutions, therefore we allocated only 25 percent of this expenditure to the military.
- Military medical insurance(payments for medical services for dependents of active-duty military personnel at nonmilitary facilities).
- Space consumption and gross investment expenditure.This information is provided by the US Bureau of Economic Analysis. We allocate 40 percent of the space consumption and gross investment of the United States for defense purposes, following the study of Euroconsult, which reports that 42.4 percent of global space spending in 2021 was meant for defense purposes.
- Grants in foreign aid.This information is provided by the US Bureau of Economic Analysis. We allocate 33 percent of this expenditure to military purposes, following the analysis by the Council on Foreign Relations.
- Net interest paid by the federal government attributed to military.This information is provided by the US Bureau of Economic Analysis (see Table A-2). We allocated this item according to the following formula:
It is important to note that we are considering federal gross investment expenditures in both the numerator and denominator, and not only the consumption expenditure.
Table A-2. Calculation of Net Interest Attributed to
US Military Spending in 2022 (Billions USD)
Comparison with Other Estimations
Table A-3 compares our method with mainstream estimations of US military spending. Here, we can see that the expenditures reported by the OMB ($765.8 billion) are significantly lower than other sources. SIPRI and NATO claim to report actual military spending of the countries, including some legacy costs, but their numbers are still below those of independent researchers (see Table A-4 below). Indeed, our estimation of the actual US military spending for 2022 is twice that reported by the White House, 1.9 times the spending estimated by NATO, and 1.8 times that reported by SIPRI.
Table A-3. Comparison with Mainstream Estimates of US Military Spending for 2022 (Current USD)
Table A-4. Independent Estimates of US Military Spending
Sources:
Andrew Cockburn, “Getting the Defense Budget Right: A (Real) Grand Total, over $1.4 trillion,” Responsible Statecraft, May 7, 2023, responsiblestatecraft.org;
Mandy Smithberger and William Hartung, ”Making Sense of the $1.25 Trillion National Security State Budget,” POGO, May 7, 2019, pogo.org;
“Don’t Just Click ‘Download’: The Case of US Military Expenditure Data,” Economics of Peace and Security Journal 14, no. 2 (2019): 55–64;
John Bellamy Foster, Hannah Holleman, and Robert W. McChesney, “The US Imperial Triangle and Military Spending,” Monthly Review 60, no. 5 (October 2008): 1–19
Using our method, actual US military spending doubled acknowledged military spending for the year 2022. Between 2007 and 2022, the gap between our measure and mainstream estimates averaged around 3 percent as a share of GDP.
Independent researchers have devised a number of critical approaches to the calculation of actual US military spending. In Table A-4, we present estimates for selected years by Cockburn; Smithberger and Hartung; Brauer; and Foster, Holleman, and McChesney. As can be seen, these authors have reached estimates that are similar to each other—and, of course, significantly higher than official estimates for the respective years.